
Patient experience is the sum of every interaction a patient has with your clinic, from the first phone call or online booking, through the waiting room and consultation, to billing and post-treatment follow-up.
It is broader than clinical quality and broader than satisfaction. That’s why no single number can capture patient experience on its own.
To run any meaningful quality improvement programme, you need to track specific metrics consistently across several categories. The seven below fall into three groups — perception (how patients feel), process (how your operation performs), and reputation (does experience match expectations).
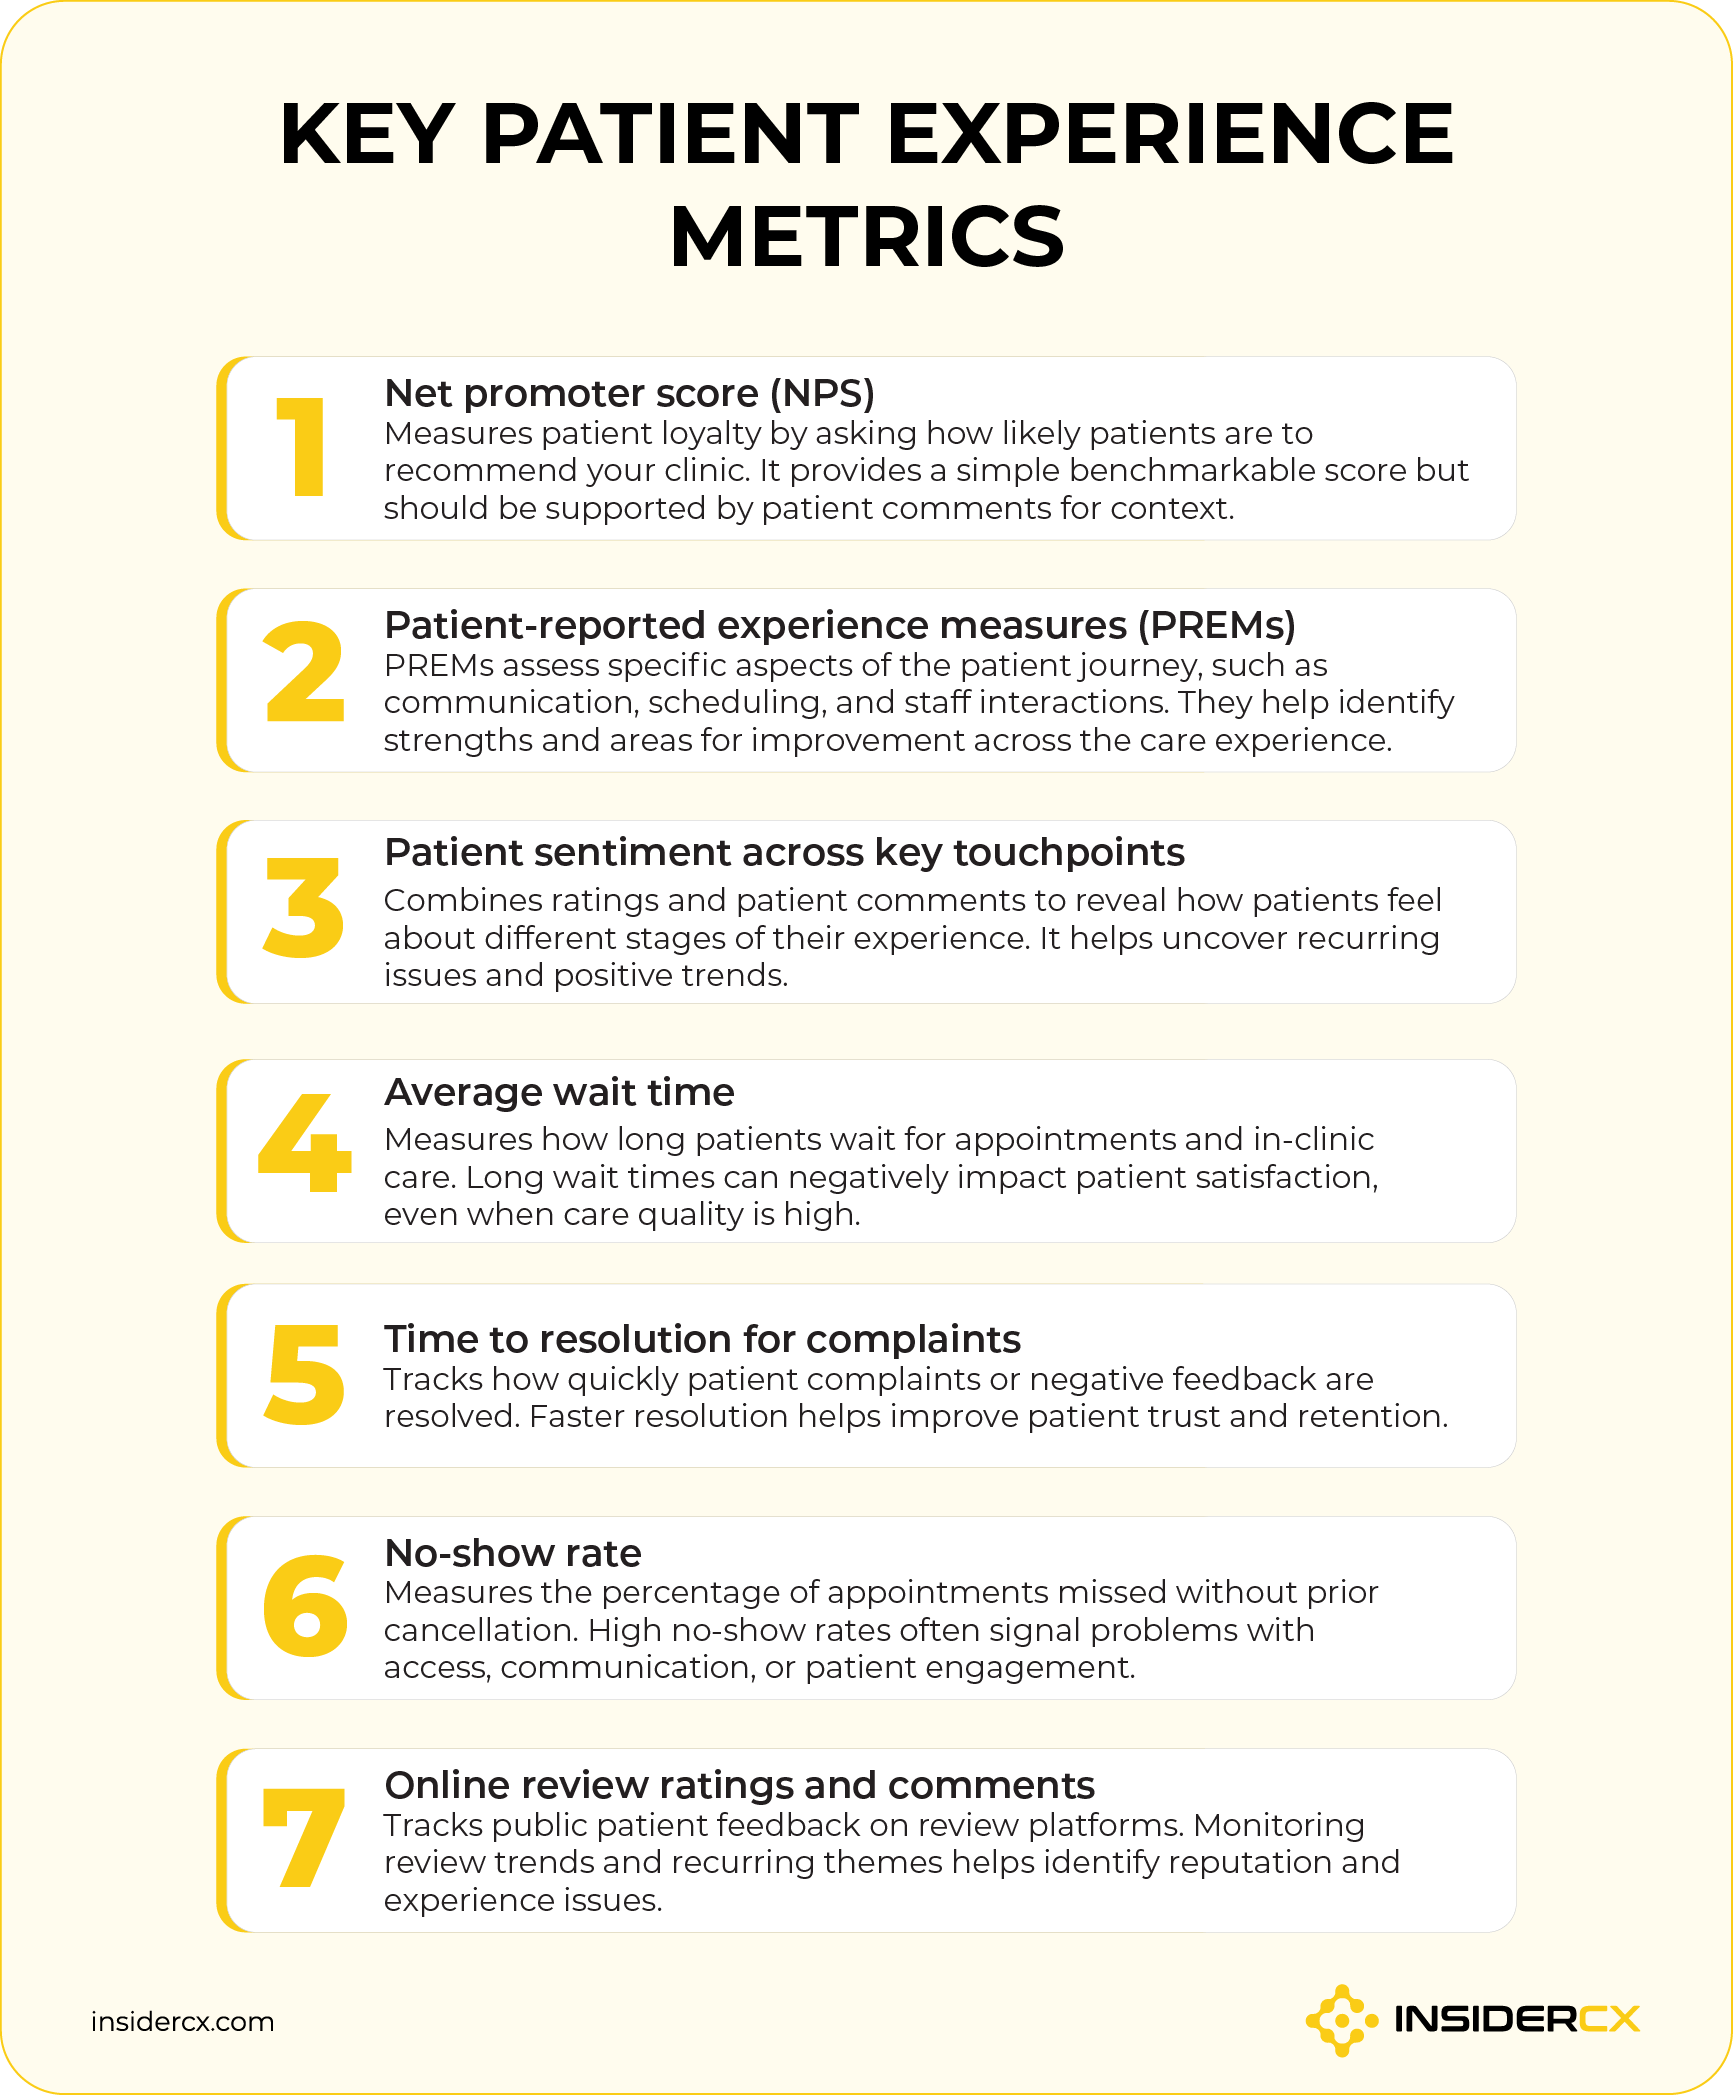
1. Net Promoter Score (NPS)
NPS is a single-question metric that asks patients how likely they are to recommend your clinic to a friend or colleague — answered on a scale of 0 to 10. Based on the number they give, respondents are sorted into promoters, passives, and detractors.
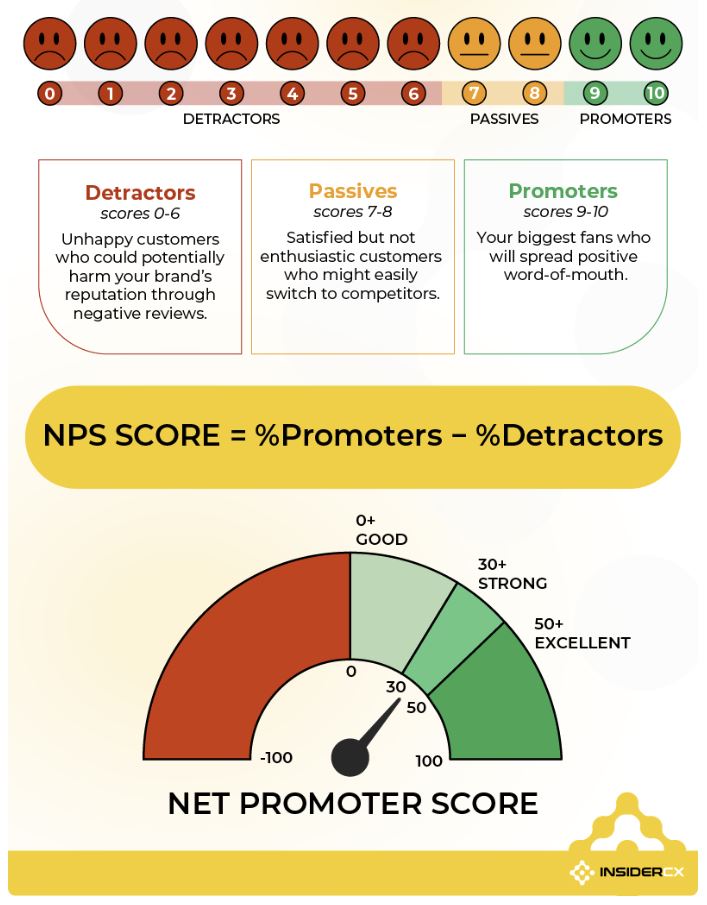
NPS gives you a fast, standardised loyalty signal you can trend over time and benchmark against peers. What it does not give you is the “why” — a single number won't tell you whether a detractor was unhappy about a six-week wait or poor service.
In other words, it’s useful and easy to track, but it should not be analysed in isolation. The fix is to always pair it with an open-ended comment that gives patients the room to explain their score. A feedback platform like InsiderCX can automate the whole process.
Healthcare NPS tends to sit lower than other sectors, partly because patients associate care with stress regardless of how well it went. Since published benchmarks vary widely, your own trend is far more important than any external average.
2. Patient-reported experience measures (PREMs)
Plenty of things shape how a patient experiences your clinic: ease of scheduling, clarity of communication, staff courtesy, cost and payment transparency, and the environment itself.
PREMs are designed to help you measure these individual parts of the patient journey and aspects of care. Because the PREM surveys are structured and repeatable, they let you compare experience across touchpoints, sites, and time periods rather than relying on anecdotes.
Don’t confuse PREMs with patient-reported outcome measures (PROMs), which capture health status and quality of life. As the AHRQ explains, the two are complementary — PREMs measure the experience of care, PROMs measure the result of it.
InsiderCX helps you design and run PREM surveys mapped to each stage of the patient journey, so you can see precisely where experience holds up and where it slips.
3. Patient sentiment across key touchpoints
At the very minimum, patient experience questionnaires should include two types of questions:
- Satisfaction scores to tell you what is wrong (or good).
- Open-ended feedback that gives context (the why behind the score).
Asking your staff to read through each and every survey comment or public review your clinic gets simply doesn’t scale.
If you are serious about measuring and improving patient experience, use a tool like InsiderCX that offers automated patient sentiment analysis.
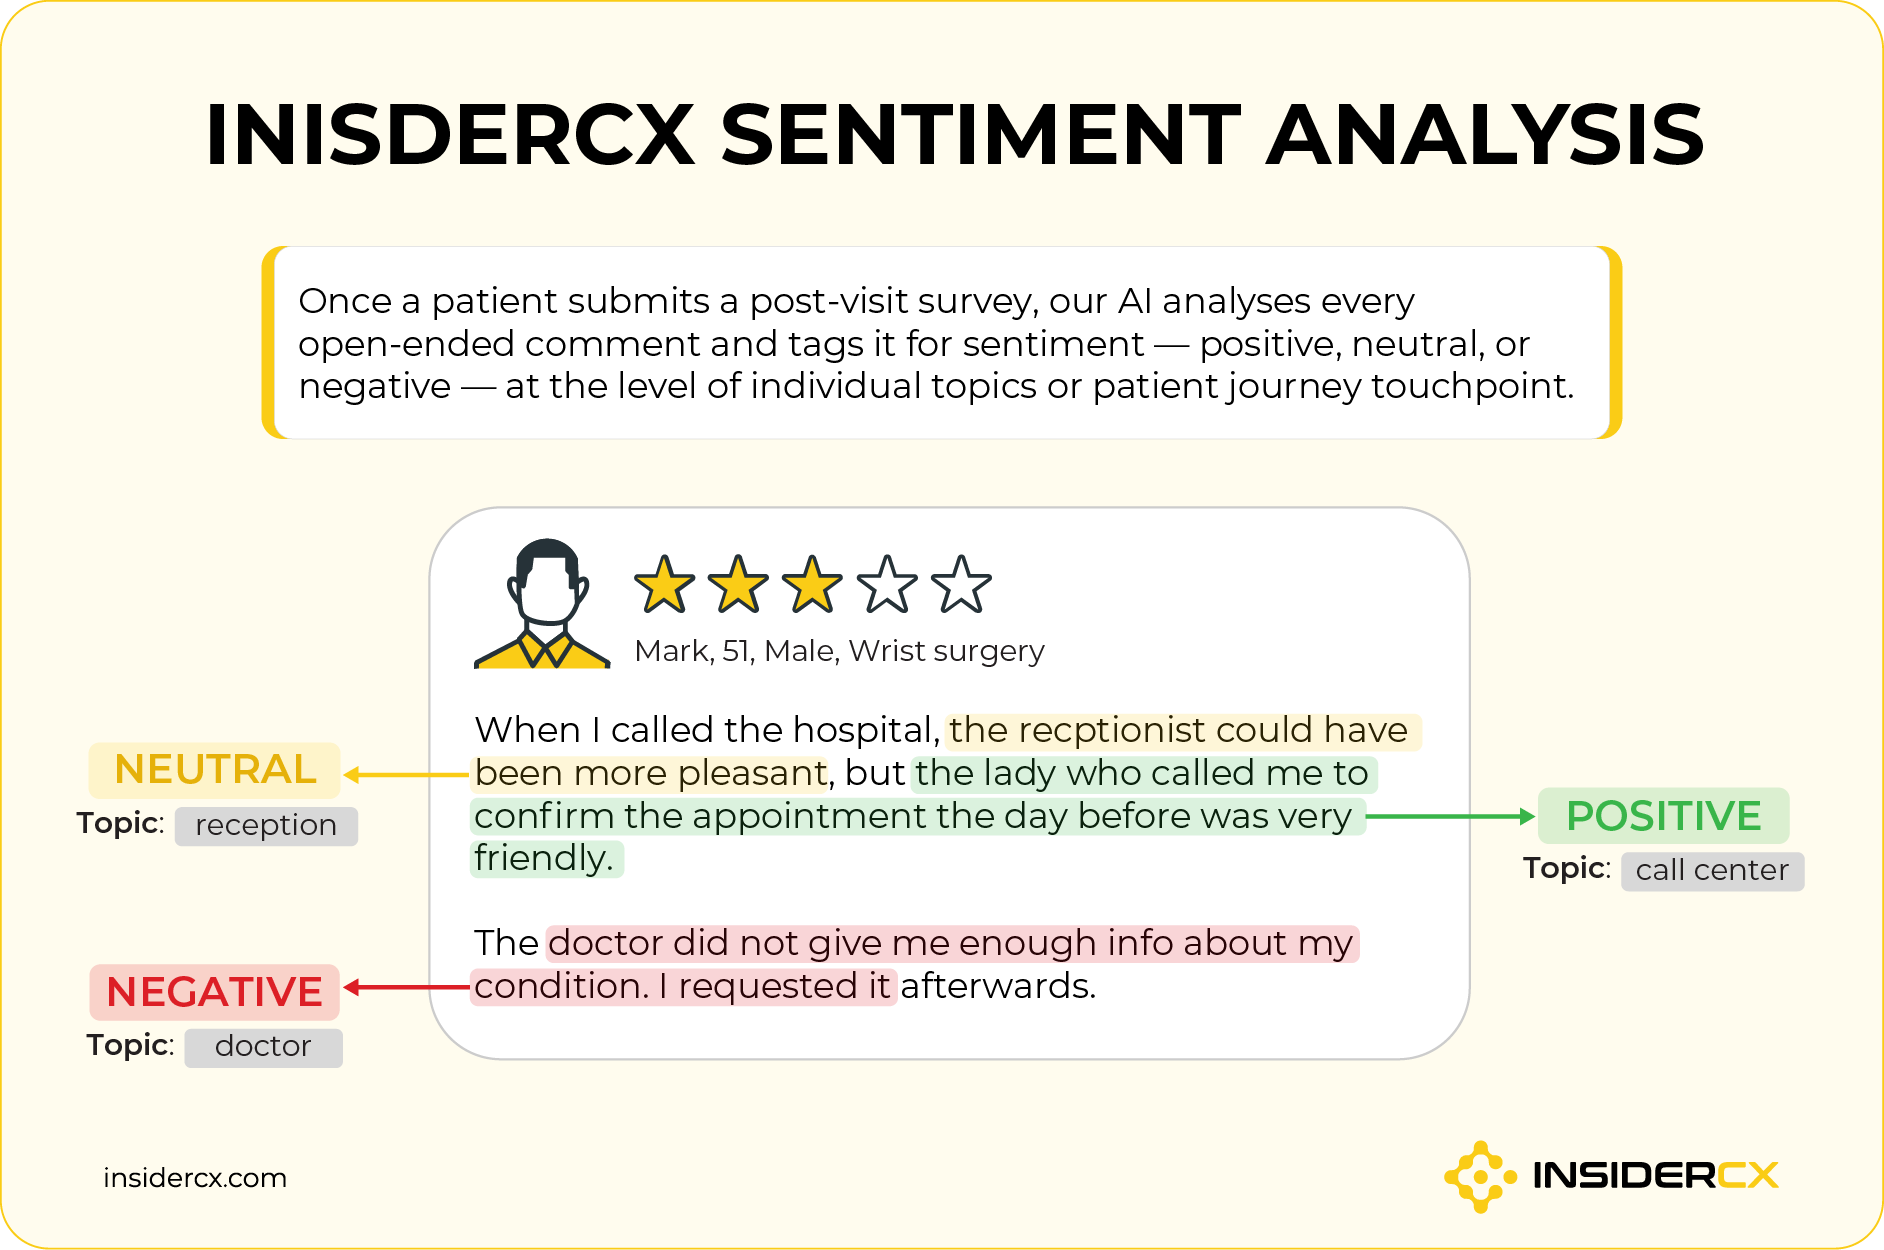
As feedback comes in, our AI reads and classifies free-text feedback in real time and groups it by touchpoint and theme. You get visual reports that surface positive and negative patterns across all key touchpoints in the patient journey without forcing someone to manually review and tag hundreds of responses.
4. Average wait time
Wait times are among the most common drivers of patient complaints, alongside poor communication and staff attitude — a pattern that holds across the NHS's published complaints data year after year.
In other words, long waits erode experience even when the clinical care is excellent.
To measure wait time accurately, separate two distinct figures:
- Appointment lead time (how many days a patient waits to get an appointment).
- In-clinic wait (how long they sit past their scheduled slot).
Timestamp check-in and consultation start, so the in-clinic figure is real rather than estimated, and track the median, not just the mean — a handful of extreme delays can hide behind a tidy average.
Acceptable wait times aren't uniform across service types. A patient expects same-day or next-day access for an urgent dental issue, but plans an ophthalmology review or a reproductive medicine consultation well in advance.
Another good approach is to track the aforementioned patient sentiment regarding wait times. If patients are complaining about it often, you should look into ways to improve (or at least communicate expectations better), even if you think the wait time is reasonable.
5. Time to resolution for complaints
How quickly you respond to a patient complaint often decides whether a dissatisfied patient stays or leaves. This applies to informal negative feedback as much as formal complaints: a sharp comment in a survey is an early warning, and a fast, genuine response can recover the relationship before it's lost.
Time to resolution is typically calculated as the elapsed time from when a complaint or piece of negative feedback is logged to when it's resolved and closed with the patient.
Ideally, you should track both your median resolution time and the proportion of cases that breach your target.
InsiderCX ticketing module helps you track this directly, with custom SLAs and ticket resolution targets so nothing slips through. Each piece of feedback becomes a ticket with an owner and a deadline, which turns "we'll get to it" into a measurable, closed-loop workflow.
6. No-show rate
Your no-show rate is the share of scheduled appointments where the patient simply doesn't arrive and doesn't cancel in advance. The calculation is straightforward:
No-show rate = (missed appointments ÷ total scheduled appointments) × 100
Benchmarks vary by specialty, but a useful rule of thumb is that a rate around 5–8% is healthy, while anything above 20% signals a real problem. Some service types do run considerably higher, so compare your rate against your own history, specialties, and different locations you run.
No-shows aren't only a revenue issue — though they do erode patient lifetime value with every empty slot — they're also a symptom. Long lead times, weak patient appointment reminders, friction in rescheduling, and thin rapport with new patients all push the rate up, so a climbing no-show figure usually points to an experience problem upstream.
7. Online review ratings and comments
When we talk about online reviews, we’re thinking of public platforms like Google, Trustpilot, or other review sites dedicated to doctors and clinics.
These reviews are public, often unprompted, and read by prospective patients deciding whether to book. It makes them both a reflection of patient experience and a driver of acquisition.
The patterns in your review scores and comments are one of the clearest external signals you have. However, it does take some skill to distinguish isolated incidents from genuine trends. One angry review about a single bad day is noise; the same complaint appearing six times in two months is a problem.
A few ways to read review comments well (if you do not have access to automated sentiment analysis):
- Group by theme: Cluster comments into categories — waiting, communication, billing, staff — so volume becomes visible.
- Weight recency and frequency: A recurring issue over the last month matters more than a one-off from a year ago.
- Cross-reference with internal feedback: If your PREMs and your reviews flag the same thing, it's definitely a real problem.
- Watch the trend, not the single score: Track how your average review rating moves over time rather than reacting to each new review.
InsiderCX gives you a dashboard to monitor public review ratings and comments in real time across platforms, and helps you generate more reviews from satisfied patients — which is also central to healthcare reputation management. More positive reviews lift your average, and a steady flow makes trends easier to spot.
How to measure patient experience well
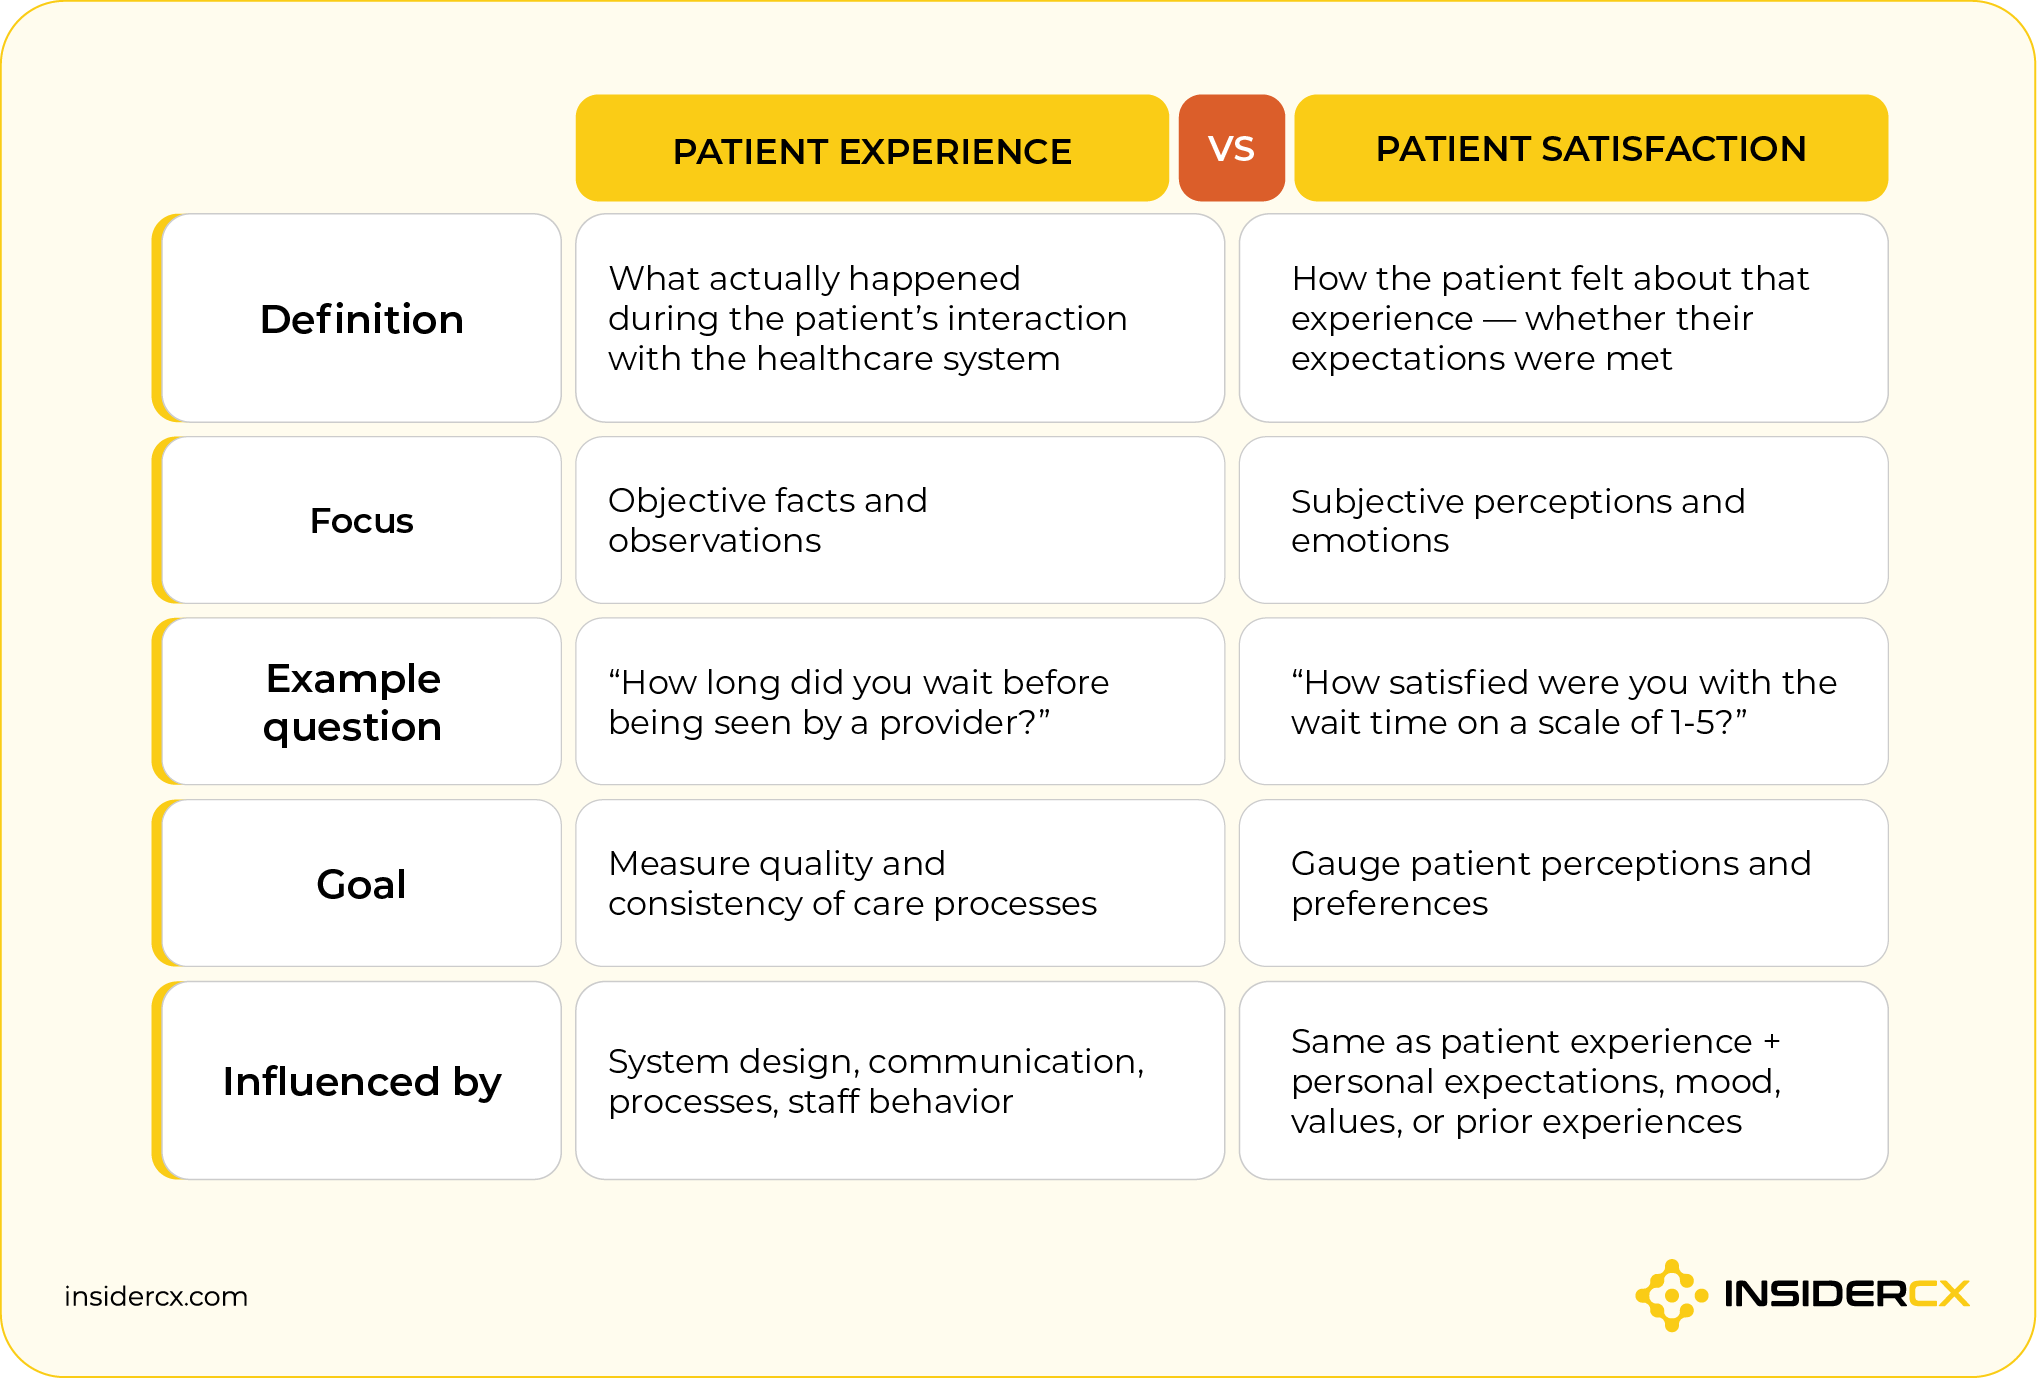
First, it's worth distinguishing between patient experience and patient satisfaction. Patient satisfaction asks whether care met expectations — while patient experience closely reflects what actually happened.
The difference matters because you can have high satisfaction despite a broken process, or a strong process and patients who simply expected more. You should track both, which is why we included NPS on this list.
If you do not approach it strategically, measuring experience well can be quite challenging.
Data sits in different systems — your booking tool, your survey platform, online review sites — and rarely talks to itself. Response rates are often low, and survey fatigue is real, so getting enough feedback is a challenge in itself. Then, when you do get it, it takes a lot of manual work to analyze it and get useful insights — so most clinics skip it or do it haphazardly.
We have helped hundreds of clinics collect, analyse, and act on feedback. Here are a few key principles to follow based on our experience:
- Map the patient journey first: Decide which touchpoints you're measuring before you choose metrics.
- Combine numbers and words: Quantitative scores show scale, while qualitative comments explain cause.
- Ask at the right moment: Send surveys 24-48 hours after the appointment, while it's fresh — and keep it short.
- Standardise surveys and feedback process: Use consistent questions and timing so results are comparable over time.
- Segment your data: Break results down by location, department, and journey stage rather than viewing one clinic-wide average.
- Close the loop: Route negative feedback to an owner and follow up — measurement without action is wasted effort.
- Trend, don't snapshot: Watch how each metric moves over time instead of (over)reacting to a single reading.
- Centralise feedback management: Pulling everything into one system is what makes the metrics comparable and the patterns visible.
For a fuller treatment of the fundamentals, our guide to patient experience covers how these pieces fit together.
Bringing the metrics together with InsiderCX
No single metric tells the whole story, but tracked together, consistently, these seven will give you a full picture of patient experience across perception, process, and reputation.
InsiderCX is a patient experience platform built for exactly that. It brings your measurement into one place, including the ability to:
- Run NPS and PREM surveys mapped to each stage of the patient journey.
- Automate sentiment analysis across free-text feedback automatically, in real time.
- Reduce no-show rates with personalized appointment reminders.
- Track complaint resolution against custom targets and SLAs.
- Monitor online reviews across different public review platforms. Reply to reviews directly from the InsiderCX platform (feature coming soon).
- Segment every metric by location, service, and doctor, simplifying internal benchmarking when running multi-site clinic groups.
Do you run a high-traffic single-site clinic or a multi-site group? Want better tools to measure and improve quality, experience, and satisfaction consistently?
Book a call with the InsiderCX team and let’s set you up with a free pilot project.


